

How to Review Marketing Performance: A CEO’s Guide
 By Ankur Saigal
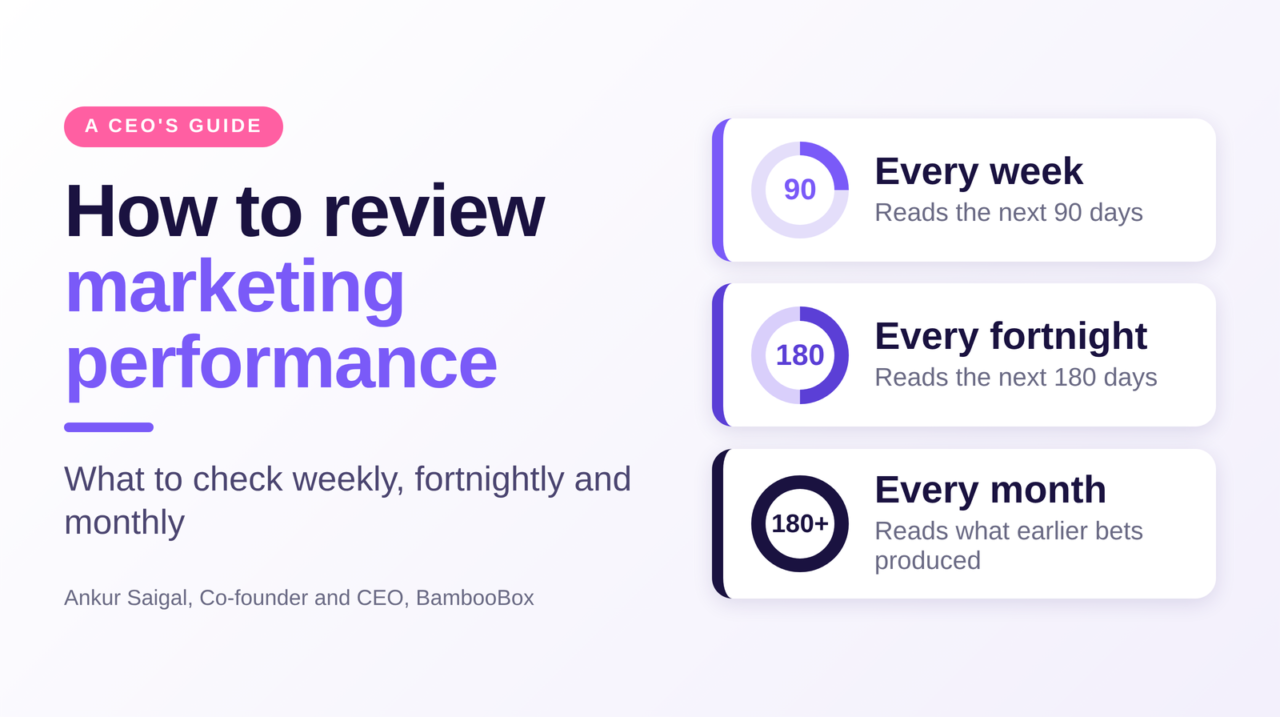
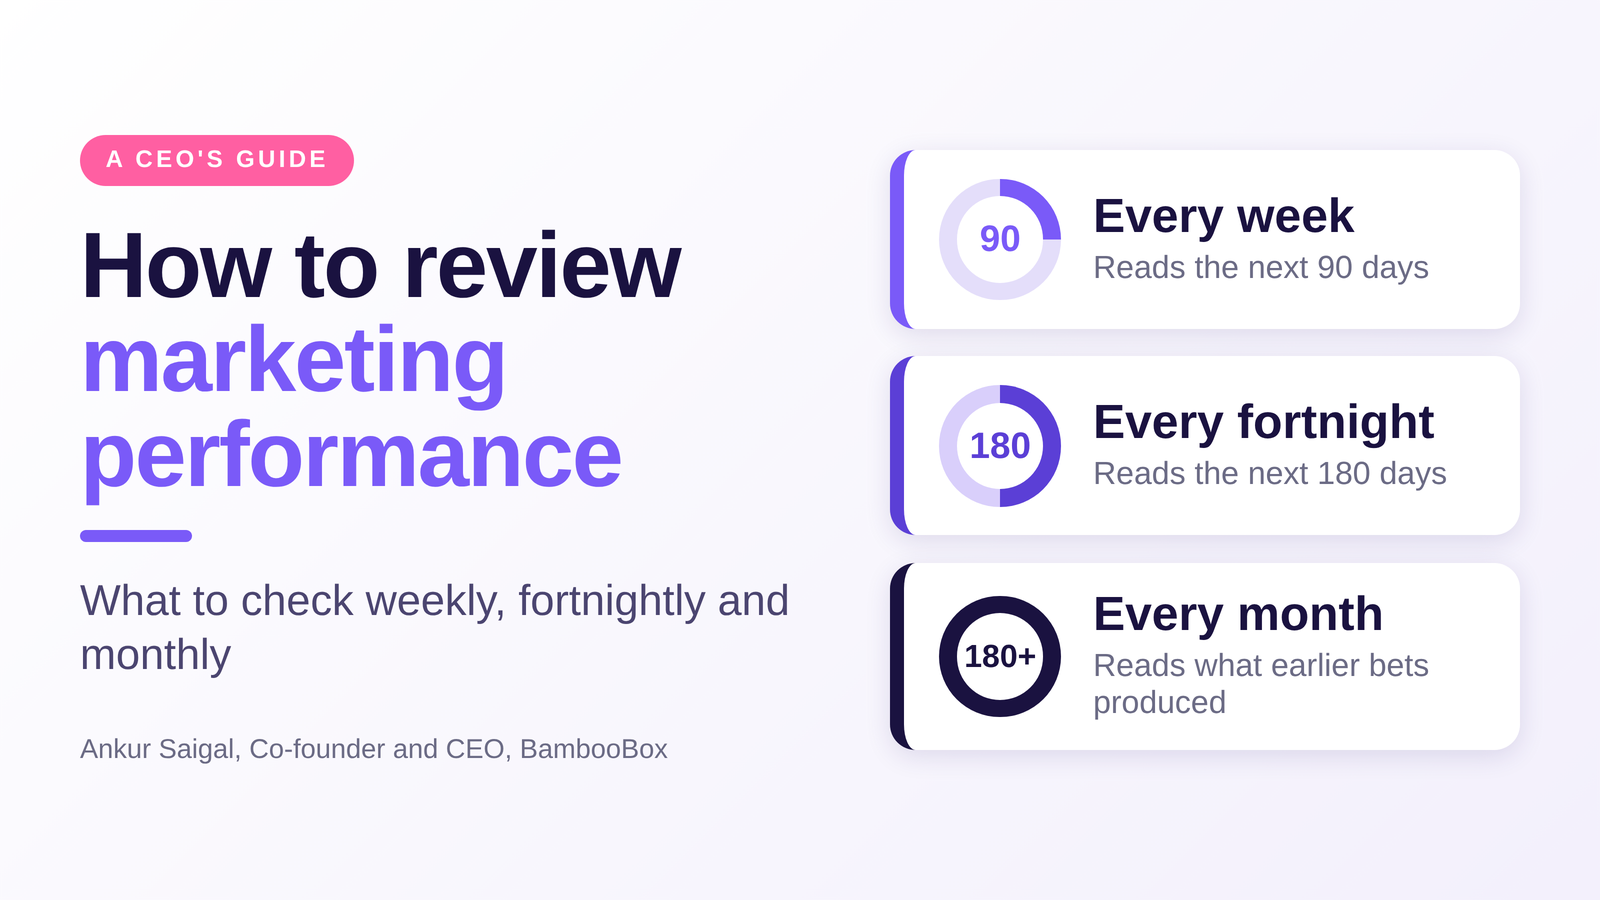
TL;DR: A CEO can review marketing performance without a 30-page deck. Every week, check ICP form-fills and the SDR-booked meetings from marketing-engaged accounts. Every fortnight, check funnel movement and direct traffic. Every month, check opportunity conversion and cost per opportunity. These rhythms line up with what marketing moves in 90 days, 180 days and beyond. You also get the questions to ask and a scorecard.
My Monday marketing sync used to go the same way every week. I would open the CRM and ask, “Where is the pipeline?” My marketing leader would open a deck and say, “Look at our impressions, web traffic and MQL growth.”
We were both right, and we were reading different clocks. I wanted this quarter’s pipeline. Marketing was showing me signals that pay off over the next 4 to 5 months. In a business with a 4 to 5 month sales cycle, that gap is guaranteed.
The fix turned out to be simpler than a new dashboard. Know which marketing metrics a CEO should check on which day, and what each one is telling you. This is the rhythm we use at BambooBox, written for founders and CEOs who run lean marketing teams.
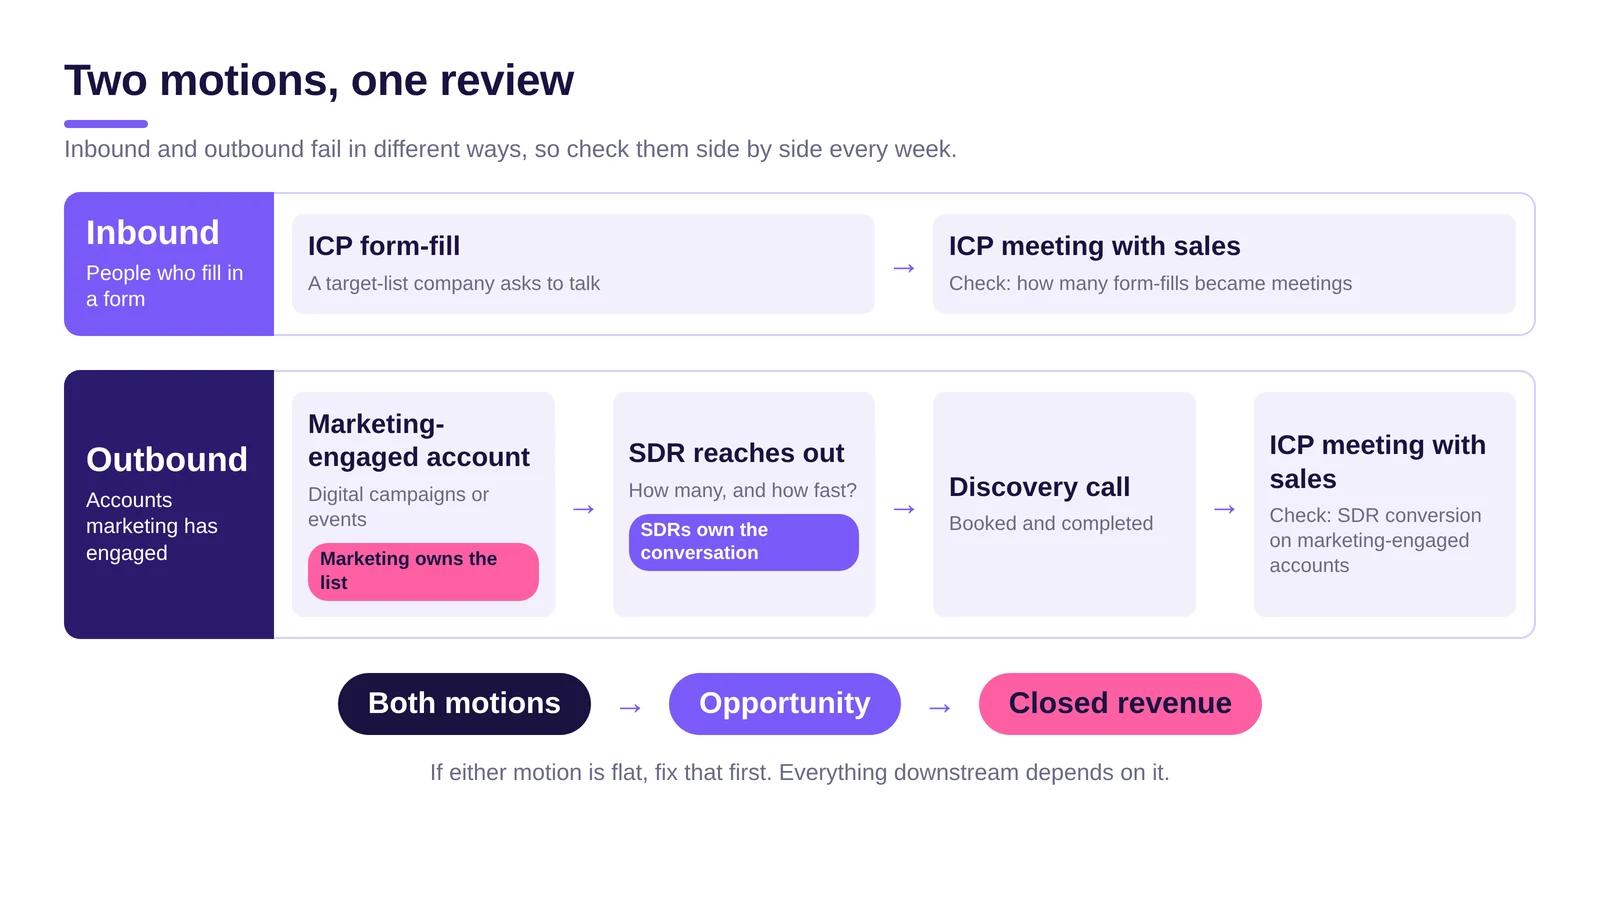
We run two motions, and the review has to cover both. Inbound is people who fill in a form. Outbound is target accounts that marketing has engaged through digital campaigns or events, which we call marketing-engaged accounts. Our SDRs (sales development reps) then reach out to them to book a meeting with sales. They fail in different ways, so they need different questions.
Table of Contents
ToggleThe two motions fail in different ways, so check them side by side every week
How often should a CEO review marketing performance?
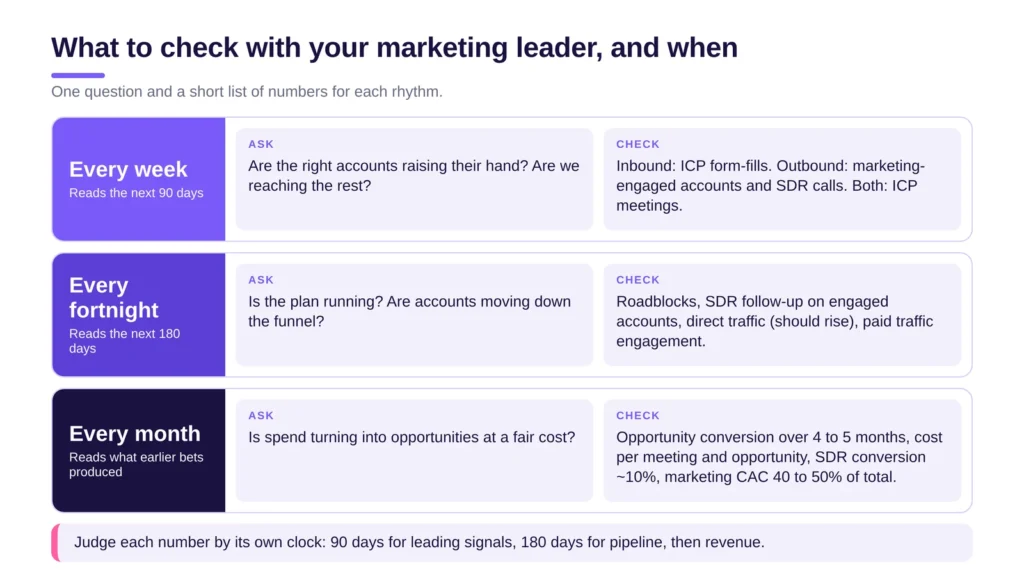
A CEO should review marketing performance on three rhythms: weekly for lead signals, fortnightly for plan execution and funnel movement, and monthly for financial metrics like cost per opportunity. Each rhythm reads a different time lag. Weekly numbers hint at the next 90 days, fortnightly numbers at the next 180, and revenue lands beyond that.
| Rhythm | The question you ask | Numbers you look at | What it tells you |
| Every week | Are the right accounts raising their hand, and are we reaching the ones who have not? | Inbound: ICP form-fills. Outbound: marketing-engaged accounts and SDR discovery calls. Both: ICP meetings and spend | Early signal for the next 90 days |
| Every fortnight | Is the plan running, and are accounts moving down the funnel? | Marketing-engaged accounts, SDR coverage of marketing-engaged accounts, direct traffic, paid traffic engagement, roadblocks | Preference and pipeline building, about 180 days out |
| Every month | Is marketing turning spend into opportunities at a fair cost? | Opportunity conversion, cost per ICP meeting by motion, cost per opportunity, SDR conversion on marketing-engaged accounts, marketing CAC | What earlier bets actually produced |
Rhythm is how often you look. Horizon is how long the work takes to pay off.
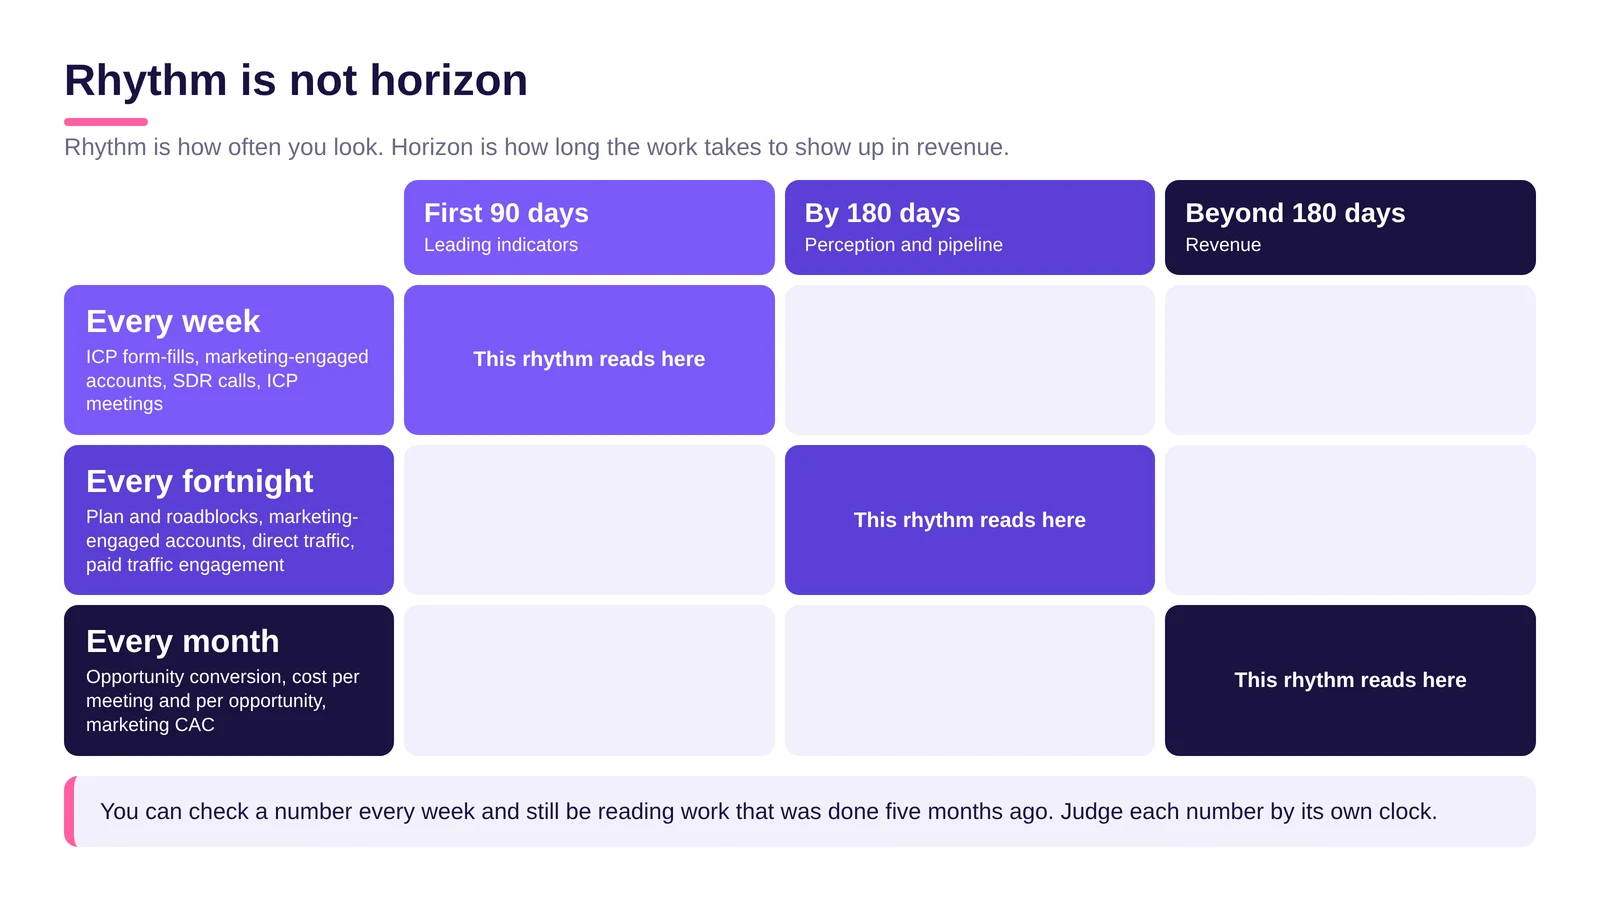
Rhythm and horizon are different things. Rhythm is how often you look. Horizon is how long the work takes to show up in revenue. You can check a number every week and still be reading work that was done five months ago.
The question also changes with the rhythm. Weekly, I ask about direction. Fortnightly, I ask about movement. Monthly, I ask about money.
Mixing them is how a Monday meeting turns into an argument.
Every week: meetings from both motions, no source debates
When I meet marketing every week, I look at the two motions side by side. Inbound is ICP form-fills and the meetings they generate.
Outbound starts with marketing-engaged accounts, meaning target accounts showing real interest through digital campaigns or events. An SDR then reaches out to book a discovery call, and that call leads to a meeting with sales. For inbound I ask how many ICP form-fills we got and how many became meetings. For outbound I ask how many target accounts became marketing-engaged, how many our SDRs reached, and how many discovery calls and sales meetings came out of it.
I also glance at spend, because it sits in the same block of our scorecard. I do not ask which campaign a lead came from, since source debates eat the whole meeting and rarely change what we do next week. I do keep the two motions apart, because inbound dries up when demand or message is weak, while outbound stalls when marketing-engaged accounts pile up without calls. The second is usually a follow-up or capacity problem, not a marketing one.
The weekly question is plain: are the right accounts raising their hand, are we reaching the ones who have not, and are both turning into meetings? If either motion is flat, that is the first thing to fix, because everything downstream depends on it.
What should a CEO review with marketing every fortnight?
Every fortnight, a CEO should review how well the marketing plan is running and whether accounts are moving down the funnel. Look at roadblocks, marketing-engaged accounts, SDR follow-up, direct traffic and paid traffic engagement. Direct traffic should rise when preference building is working, because buyers who already know you type your name.
This is the meeting where you get into the plan. Where is execution slipping? What is stuck with sales, content or approvals? I use this slot to clear roadblocks, because a stuck campaign costs more than a mediocre one.
On the outbound side, check how many marketing-engaged accounts the SDR team actually worked, and how quickly. A marketing-engaged account that nobody calls is spend with nothing to show for it. This is where marketing and sales meet, so both leaders should be in the room.
Then look at funnel movement: how many target accounts moved from unaware to marketing-engaged, through digital campaigns or events, since the last review? Preference is the reason I care. According to Forrester (Buyers’ Journey Survey 2025, published February 2026), 68 percent of B2B buyers already have a front-runner vendor in mind when they start buying, and that front-runner wins 80 percent of the time.
You cannot see preference directly. You can see its shadow: more people typing your name into a browser, better engagement on paid traffic and more marketing-engaged accounts. Visibility inside AI answers from tools like ChatGPT feeds the same signal.
Which marketing metrics should a CEO check every month?
Once a month, a CEO should check the financial metrics that show whether spend turns into pipeline: opportunity conversion, cost per ICP meeting (inbound and outbound), cost per opportunity, SDR conversion on marketing-engaged accounts and marketing’s share of CAC. Measure pipeline conversion over a window close to your sales cycle.
Our sales cycle runs about 4 to 5 months, so we look at how much pipeline converts over that same 4 to 5 month window. If your cycle is nine months, use nine. A 30-day window will always make a long-cycle business look broken. CAC, or customer acquisition cost, is the total sales and marketing spend needed to win one customer.
Be clear about what you call an MQL, a marketing qualified lead that marketing judges ready for sales. There are two kinds, and MQL conversion rates look very different for each.
A demo form-fill is someone asking to talk, and about 40 percent of those ICP form-fills should convert into a sales-qualified lead. A designated MQL is someone whose engagement crossed a threshold, and about 10 percent is a good number there. Blending the two into one average hides problems in both.
| What you check | What good looks like (our experience) | If it is off, look here |
| ICP demo form-fill to sales-qualified lead | ~40% | Is sales following up the same day? Are the form-fills really ICP? |
| Engagement-designated MQL to sales-qualified lead | ~10% | Is the MQL threshold too low, or is the ICP fuzzy? |
| SDR conversion on marketing-engaged accounts | ~10% | If lower, engagement may be noise rather than real preference, or SDR follow-up is slow |
| Marketing CAC | About 40 to 50% of total CAC | Cost per opportunity, channel mix, and sales efficiency |
| Cost per ICP meeting (inbound and outbound separately) and cost per opportunity | Falling every quarter, even at the same volume | Which motion or channel is pushing cost up? What did the team change after last quarter’s results? |
| Channel role check | Each channel does its job, for example LinkedIn sends engaged visitors to your website | Rebalance budget, or fix the message for that channel |
On outbound, the number I trust most is SDR conversion on marketing-engaged accounts: of the marketing-engaged accounts, how many did SDRs turn into a conversation? It tells you whether engagement reflects real preference or just clicks. Marketing owns the list of marketing-engaged accounts, SDRs own the conversation, and both own that percentage.
These ranges come from our own work, not from an industry standard. They will move with your deal size and sales motion. Use them as a starting point for a conversation with your team, not as a verdict.
Where should a CEO look when the marketing numbers look wrong?
When marketing numbers look wrong, start with the handoff between marketing and sales before touching campaigns. In our experience, the usual causes are three: the two teams disagree on the ideal customer, marketing is pushing leads too early because it is goaled on meeting counts, or sales treats pipeline as marketing’s job.
What you see | First place to look |
Meetings happen, but few become pipeline | What marketing is saying versus what sales is selling. Also check whether both teams describe the same ideal customer. |
Marketing-engaged accounts rise, but SDRs book few calls | SDR follow-up speed and capacity. Also check whether the marketing-engaged accounts are really ICP. |
Form-fills rise, but few become meetings | ICP fit of the form-fills and same-day follow-up. |
Opportunities convert slowly, or win rarely | The late-stage message and the sales process. Check whether the right buying group was reached. |
Weak top of funnel despite large spend | Targeting and message. Check whether budget is chasing the wrong accounts. |
Ask the harder question too. Does your sales team believe pipeline is a problem they have outsourced? If so, no metric will fix that. It needs a conversation between you and your sales leader.
Judge each number by its own clock
This is the part I wish I had understood earlier. Marketing does not pay back on one schedule, so one scorecard read at one moment will mislead you.
- First 90 days: leading indicators. Judge ICP form-fills, marketing-engaged accounts and the ICP meetings from both motions. Revenue is the wrong test here, and asking for it is how good long-term bets get cut in month two.
- By 180 days: perception and pipeline. Judge whether target accounts know you and whether that awareness converts into pipeline. Impressions alone are the wrong test at this point, and celebrating them in month six means paying for noise.
- Beyond 180 days: revenue. Judge closed revenue and cost per opportunity against a window close to your sales cycle.
This is also why your marketing leader needs time before you pin them to revenue. Give them 90 days to show leading indicators and a full sales cycle to show revenue. The reverse failure is just as real: if the leading indicators never move, do not wait for revenue to tell you.
Judge each number by its own clock.
How we run this at BambooBox
My own experience as a CRO started all of this. Our campaigns produced plenty of leads, yet only one to two percent of marketing-query leads turned into opportunities. We built BambooBox, the AI-Native ABM agency, so lean teams can get predictable pipeline without the burden of running the machinery themselves.
Our Forward Deployed Marketers run this same weekly, fortnightly and monthly rhythm with customers, and take responsibility for lead-to-opportunity pipeline targets. The program pairs always-on engagement of target accounts with a same-day SDR response when an account shows a buying signal.
We made a simple version of our tracker, with one tab for each rhythm: download the scorecard template (Excel). It is built for lean marketing teams that need clarity more than another dashboard.
What to do on Monday
Skip the status deck. Pick the rhythm that is next on your calendar and ask its one question.
This week, ask how many ICP form-fills you got, and how many marketing-engaged accounts your SDRs reached and turned into meetings. In two weeks, ask which target accounts moved down the funnel and whether direct traffic is rising. At month end, ask what a meeting and an opportunity cost in each motion, and what share of marketing-engaged accounts your SDRs converted.
Then, for each marketing bet, ask which clock it is on. You will stop judging a 4 to 5 month engine with a 30-day spreadsheet. If you want a second pair of eyes on your own numbers, you can book a 20-minute pipeline diagnostic with one of our Forward Deployed Marketers.


